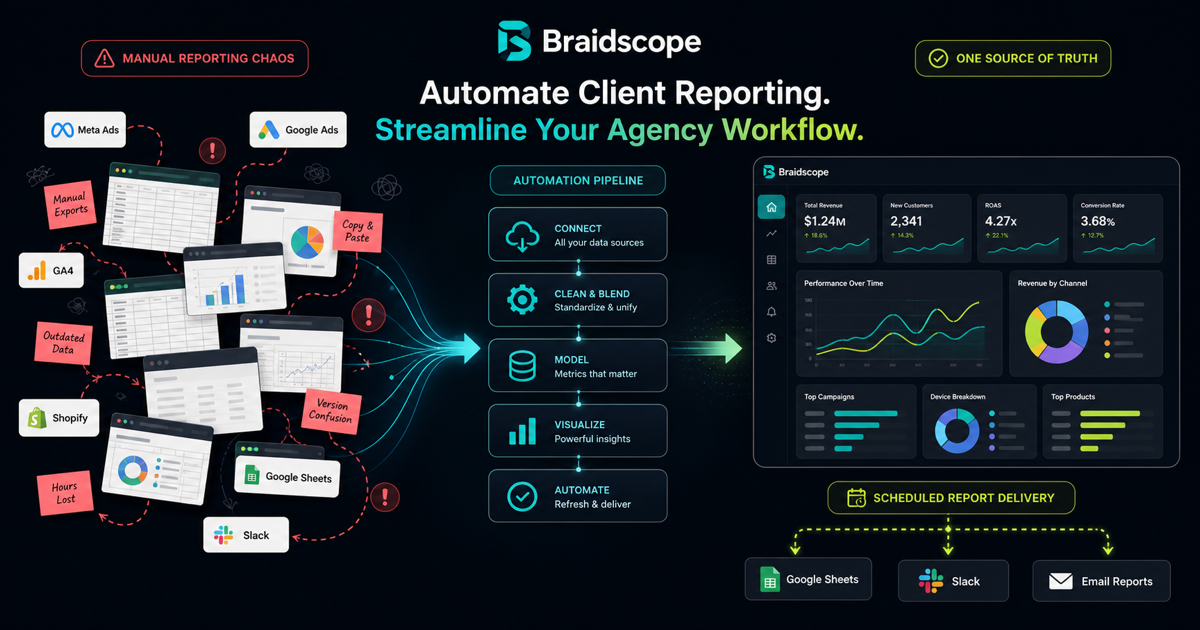
Most agency owners know exactly how their Monday mornings feel: someone on the team is pulling data from Meta Ads, copying it into a spreadsheet, reformatting the numbers to match last week’s format, and hoping nothing breaks before the client call at 11am.
This is a solved problem. Not partially solved. Fully solved, for agencies willing to set up the right system once.
Here’s how to automate client reporting from start to finish.
Quick takeaways
- Client reporting automation has four layers: collection, aggregation, visualization, and delivery.
- Automating only one layer still leaves your team doing manual cleanup somewhere else.
- The goal is not to remove human judgment. It is to stop humans from copying numbers.
The real audience for reporting automation
Agency owners want automation because it protects margin. If reporting takes 30 to 60 hours a month, growth becomes expensive before it becomes profitable.
Founders running their own marketing want automation because they are tired of making decisions from scattered tabs.
Business leaders want automation because they want the truth without waiting for someone to prepare a deck.
Good automation serves all three, but it still needs human judgment. The system should pull the numbers. A person should own the recommendation.
Why Manual Reporting Is Costing You More Than You Think
Before diving into the setup, it’s worth understanding what manual reporting actually costs.
For an agency with 10 clients, a typical Monday reporting workflow looks like this:
- Pull data from Meta Ads: 20 minutes per client
- Pull data from Google Ads: 15 minutes per client
- Pull e-commerce data from Shopify: 20 minutes per client
- Format and compile into a report: 30 minutes per client
- Review and QA the numbers: 15 minutes per client
That’s 100 minutes per client. At 10 clients, you’re at 17 hours of reporting work per week. That’s nearly half a full-time employee dedicated exclusively to copying and formatting data.
At an average agency billing rate of $75/hour, that’s $1,250/week in labor costs, just for reporting. Over a year, that’s $65,000.
Automating this doesn’t just save time. It saves significant money and gives your team back hours they can spend on strategy, client relationships, and actual growth work.
The Four Layers of Automated Client Reporting
Fully automated reporting requires four things working together:
- Automated data collection: data pulls itself from all sources on a schedule
- Automated aggregation: all data lands in one place per client, properly organized
- Automated visualization: dashboards update without anyone touching them
- Automated delivery: clients get their reports without anyone hitting “send”
Most agencies solve one or two of these. The ones that solve all four are the ones that can scale to 30+ clients without increasing headcount.
Step 1: Automated Data Collection
The first step is eliminating manual data pulls.
Every platform you report on has an API. Meta Ads, Google Ads, Google Analytics, Shopify, and HubSpot all expose data programmatically. The question is which tool connects to them and pulls that data on a schedule.
Options:
Native integrations (recommended): Tools like Braidscope connect directly to each platform via OAuth. You authorize the connection once. After that, data syncs automatically on a schedule (hourly or daily, depending on the platform). No code. No Zapier. No brittle spreadsheet formulas.
Supermetrics: A data connector that works well with Google Sheets and Looker Studio. Good for technically capable agencies. Requires manual template setup per client.
n8n or Make (Integromat): For agencies with a developer or ops person, these workflow automation tools can pull from any API and push to a spreadsheet or database. Very flexible. Requires ongoing maintenance.
Google Sheets API connectors: Native Google Sheets integrations for Google Ads, Google Analytics, and Search Console. Limited to Google’s ecosystem.
The non-negotiable here: the connection should be OAuth-based (not API keys stored in spreadsheets) and the sync should be scheduled automatically, not triggered manually.
Step 2: Automated Aggregation
Once data is pulling automatically, it needs to land somewhere organized.
The worst setup is data landing in different places for each client: one spreadsheet for Meta, another for Google Ads, another for Shopify. Someone still has to pull it all together.
The right setup is a single data store per client workspace, where all sources are unified automatically.
Options:
Dedicated reporting platform: Tools like Braidscope handle this natively. Each client has one workspace. All their data sources feed into it. Nothing to aggregate manually.
Google Sheets with Supermetrics: Possible, but you need a template that pulls all sources into one sheet. Setting this up per client takes time. Maintaining it when platforms change their APIs takes more time.
A data warehouse (BigQuery, Snowflake): This is the enterprise approach. Data from all sources lands in a central warehouse. A BI tool queries it. Powerful, but expensive and requires significant technical setup.
For most agencies under 50 clients, a dedicated reporting platform is the right trade-off. You get aggregation without building infrastructure.
Step 3: Automated Visualization
With data aggregated, you need dashboards that update themselves.
The worst version of this is a dashboard you have to refresh manually or a report template you copy and paste numbers into. The best version is a dashboard that’s always showing yesterday’s (or this morning’s) data without anyone touching it.
What good automated dashboards look like:
- Data refreshes on a schedule (at minimum, daily)
- Key metrics are visible at a glance: spend, revenue, ROAS, conversions
- Trend charts show the last 7, 14, 30 days without manually changing the date range
- Anomalies are flagged visually (a number in red, a percentage drop highlighted)
- The client can view the dashboard anytime without needing to ask you for a screenshot
Braidscope handles this by building dashboards automatically when you connect a data source. The Meta Ads dashboard appears as soon as you connect Meta. The Shopify dashboard appears as soon as you connect Shopify. No configuration. No template selection. The system knows what metrics matter for each source.
Looker Studio can do this with the right setup, but requires manual template creation per client and regular maintenance when platforms update their APIs.
Step 4: Automated Report Delivery
The final layer is getting reports to clients without a human hitting “send.”
Most agencies handle this manually: someone compiles the numbers, formats a PDF or email, and sends it. Automating this layer saves 15 to 30 minutes per client per week.
Three ways to automate delivery:
Shared dashboard link: Give clients a link to their live dashboard. They can check anytime. No PDF. No email. Just a bookmark they open when they want to see their numbers. This works well for clients who are actively engaged with their data.
Automated email digests: Schedule weekly or monthly email summaries that include key metrics. These go out automatically. The client gets a digest in their inbox every Monday without you doing anything.
Automated Slack reports: For clients who live in Slack, a weekly message in their #marketing-reports channel with key numbers is often more effective than a PDF they’ll never open. Braidscope handles this natively.
The best agencies use all three: a live dashboard for engaged clients, email digests for weekly check-ins, and Slack notifications for anomalies (“Your ROAS dropped 40% yesterday”).
The Full Automated Workflow
When all four layers are in place, the workflow looks like this:
- Client workspace is created once (5 minutes)
- Data sources are connected once (Meta, Google Ads, Shopify, 2 minutes per source)
- Dashboards appear automatically
- Data syncs daily without anyone touching anything
- Weekly digest emails go out automatically every Monday
- Slack alerts fire automatically when something unusual happens
- Client can check their dashboard anytime via a shared link
The agency’s team is not involved in any of this after the initial setup. Monday mornings are free.
Common Mistakes When Automating Client Reporting
Mistake 1: Automating the wrong format
Some agencies spend weeks automating PDF reports with charts that look exactly like their manual PowerPoint. The problem: PDFs are static. Once you automate a live dashboard, clients prefer checking it directly. Don’t automate an inferior format.
Mistake 2: Partial automation that still requires human touch
If your automated system pulls data to a spreadsheet, but someone still has to copy it into a report, you’ve only automated half the problem. The manual step becomes the bottleneck.
Mistake 3: Different setups for different clients
Bespoke automation per client doesn’t scale. If you build a custom Zapier workflow for one client and a custom Google Sheets template for another, you have 20 different systems to maintain. The right move is one standardized system that all clients fit into.
Mistake 4: No anomaly detection
Automation that just delivers numbers isn’t enough. The most valuable reporting catches things that went wrong before the client does. Automated alerts for spend spikes, ROAS drops, or traffic anomalies are what convert clients from “happy to get reports” to “can’t live without you.”
What Automation Looks Like at Different Agency Sizes
5 clients or fewer: A shared Looker Studio template with Supermetrics connectors and manual email delivery is manageable. The setup cost is worth it.
5 to 15 clients: This is where dedicated reporting platforms earn their keep. The time saved on setup (each new client takes 5 to 10 minutes vs. 2 to 4 hours for a manual Looker setup) pays for the monthly subscription quickly.
15 to 40 clients: You need flat-rate pricing and full automation. Per-client pricing tools become prohibitively expensive. Braidscope’s Agency Pro plan covers unlimited clients at $199/month.
40+ clients: You probably need a hybrid: a platform for dashboards plus a data warehouse for complex analytics. Most agencies don’t reach this scale before the platform handles it well.
Getting Started: The Practical First Step
If you’re reading this and you’re still running manual reporting, the most important thing is to stop trying to do everything at once.
Start with one client. Pick your most data-heavy client (the one who gets the most Monday-morning reports). Set up an automated dashboard for them. Get the Slack digest running. See how much time you save in a week.
Once it works for one client, the system applies to every new client you add. That’s the compounding value of automation: the 10th client takes the same 10 minutes to set up as the first.
Braidscope is built for this workflow. Connect once, dashboard appears, reports deliver automatically. We’re currently accepting agencies into the closed beta at founder pricing.
Frequently Asked Questions
Do I need to be technical to automate client reporting?
No. Tools like Braidscope are specifically built for non-technical agency owners. You connect your client’s data sources via OAuth (no API keys, no code), and the system handles everything else. If you can use Google Analytics, you can set this up.
How long does it take to set up automated reporting for a new client?
With a purpose-built tool, 5 to 15 minutes. With a DIY setup (Supermetrics + Looker Studio), 2 to 4 hours per client. The upfront time difference is why agencies with 15+ clients almost always move to a dedicated platform.
Can I still customize the reports for each client?
Yes. Automation doesn’t mean one-size-fits-all. You can configure which metrics are highlighted, what cadence reports go out, and what alert thresholds trigger notifications. The baseline is automated; the customization sits on top.
What happens when a client’s API credentials expire?
Good reporting platforms alert you immediately when a connection drops and make it easy to reconnect in one click. This is one reason OAuth-based integrations are safer than manually stored API keys.
Braidscope is a client reporting platform for marketing agencies. Join the closed beta.