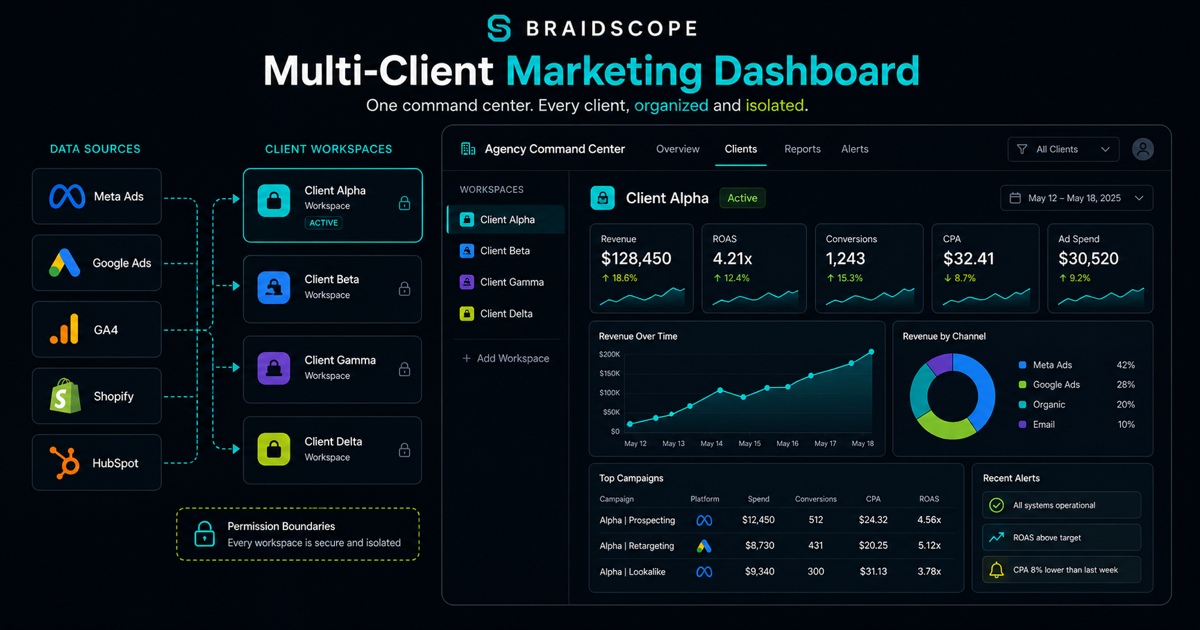
Every marketing agency hits the same wall. The first client dashboard is easy. The second one is fine. By the fifth or sixth, you’re realizing that you’ve built the same thing five times and you’ll need to build it again for the next client, and the one after that.
A proper multi-client dashboard setup solves this problem permanently. You build the system once. Every new client slots in. This guide explains how to do that.
Quick takeaways
- A multi-client dashboard is one system where each client has an isolated workspace.
- The main value is operational: faster setup, fewer logins, cleaner permissions, and consistent data.
- The dashboard should be built around the reporting package your agency sells.
Who needs this kind of dashboard?
Agency owners need it when client reporting starts stealing delivery time.
Founders need a version of it when their own company has too many disconnected platforms and no single source of truth.
Business leaders need it when they want one central place to see marketing, revenue, and pipeline without asking three teams for updates.
The structure changes by audience, but the principle is the same: one trusted view beats ten disconnected logins.
What “Multi-Client Dashboard” Actually Means
There are two common approaches to dashboards at agencies, and they’re very different:
Option A: One dashboard per client. Each client gets a separate dashboard. Separate Looker Studio report. Separate spreadsheet. Separate login (maybe). The agency owner or account manager has to switch between 10 different places to check on 10 different clients.
Option B: One platform for all clients. Every client lives in the same system. You log in once. You switch between clients in the sidebar. Each client sees only their own data. You see everything.
Option A is what most agencies start with. Option B is what successful agencies move to.
The difference isn’t just convenience. Option B means:
- New client setup takes 10 minutes, not 3 hours
- Switching between clients takes 1 click, not 5 browser tabs
- Your team has one system to learn, not 20
- Data consistency is built in, not manually enforced
What Should a Multi-Client Marketing Dashboard Include?
Before building anything, it’s worth agreeing on what a good client dashboard actually contains. The answer depends on your clients’ channels, but most marketing agencies report on a consistent core:
Paid Media Metrics (Meta Ads, Google Ads)
- Total spend (this period vs. last period)
- Revenue or conversions attributed
- Return on ad spend (ROAS)
- Cost per acquisition (CPA)
- Impressions, clicks, CTR
- Top-performing campaigns and ad sets
Ecommerce Metrics (Shopify, WooCommerce)
- Total revenue
- Orders and average order value
- Sessions and conversion rate
- Revenue by channel (organic, paid, email, direct)
- Top-selling products
SEO and Organic Traffic (Google Analytics / GA4, Search Console)
- Sessions by channel
- Organic traffic trend
- Top landing pages
- Bounce rate or engagement rate
- Goal completions
Email and CRM (Klaviyo, HubSpot, Mailchimp)
- Email revenue attribution
- Open rate, click rate
- Subscriber growth
- Pipeline or deal movement (for B2B clients)
Not every client needs all of these. A paid media agency might only report on Meta and Google Ads. An ecommerce-focused agency might add Shopify and Klaviyo. The multi-client dashboard system needs to be flexible enough to handle different combinations per client.
The Three Ways Agencies Build Multi-Client Dashboards
Method 1: Spreadsheets (The Starting Point)
Almost every agency starts here. A Google Sheet for each client, with data pulled manually or via Supermetrics. It works for one or two clients. It falls apart at five.
Problems with spreadsheets at scale:
- Manual data entry creates errors
- Formulas break when platforms change their data structure
- Sharing requires managing permissions per client
- No real-time data, only as fresh as the last manual pull
- No anomaly detection
- Fragile when someone leaves the team who built the template
When spreadsheets make sense: Early stage, 1 to 3 clients, when you’re still figuring out what to report.
Method 2: Looker Studio + Supermetrics (The DIY Approach)
For technically capable agencies, Looker Studio with Supermetrics connectors is a powerful (and relatively affordable) stack.
Supermetrics pulls data from Meta, Google Ads, Shopify, and 50+ other platforms into Google Sheets or directly into Looker Studio. You build a Looker Studio template. You copy the template per client and point it at each client’s data source.
Why this works:
- Automated data pulls
- Real-time or near-real-time data
- Free to build (Supermetrics has a cost, but Looker Studio is free)
- Highly customizable
Why this breaks down at scale:
- Template setup per client still takes 1 to 2 hours
- When Looker Studio or a platform API changes, all templates need updating
- No client workspace isolation (you need to manage sharing manually)
- No AI interpretation layer
- No automated report delivery
At 10 clients, the maintenance burden of this setup becomes a part-time job.
Method 3: Purpose-Built Multi-Client Reporting Platform (The Scalable Approach)
The third option is using a tool built specifically for this use case. Platforms like Braidscope, AgencyAnalytics, and DashThis are all purpose-built for multi-client agency reporting.
What a purpose-built platform gives you:
One login, all clients. A sidebar lists all your clients. Click a client, see their dashboard. No tab-switching. No bookmark management.
Isolated workspaces. Each client sees only their own data. No configuration required. No accidental data bleed between clients.
Automatic dashboard generation. Connect a client’s Meta Ads account, and the Meta Ads dashboard appears. Connect their Shopify, and the Shopify dashboard appears. No template configuration.
Shared report templates with per-client data. The dashboard layout is consistent across clients (important for account manager efficiency) while the data is specific to each client.
Automated delivery. Weekly email digests and Slack notifications go out automatically. No human hits send.
The primary trade-off is cost versus flexibility. Purpose-built platforms cost money. They don’t offer infinite customization. For most agencies, that trade-off is strongly in favor of the platform because the time saved on setup and maintenance pays for the subscription many times over.
How to Set Up a Multi-Client Dashboard System: Step by Step
Regardless of the tool, the setup process follows the same logic.
Step 1: Define Your Standard Reporting Package
Before building any dashboard, agree on what you report for every client by default. This is your “reporting package”, the metrics every client gets whether they ask for them or not.
For most agencies, this is:
- Paid media overview (spend, ROAS, CPA)
- Traffic overview (sessions by channel)
- Conversion overview (conversions, revenue, or leads)
- Month-over-month trend for each
Document this. It becomes the template all your dashboards follow.
Step 2: Create Client Workspaces
In a purpose-built platform, this means creating a workspace for each client and naming it clearly (company name, not “Client 12”). In Looker Studio, this means creating a folder per client.
The workspace is where everything for that client lives: their data source connections, their dashboards, their report schedule.
Step 3: Connect Data Sources
This is the most important step to get right, because the quality of your dashboard depends entirely on the quality of your data connections.
Use OAuth-based connections wherever possible. OAuth means the platform gets authorized access via the platform’s own login flow, such as Meta Ads login, Google login, or Shopify login. No API keys stored in spreadsheets. Access can be revoked by the client at any time. Much safer.
For each client, connect:
- Their ad platforms (Meta Ads Manager, Google Ads)
- Their analytics (GA4 or Google Analytics)
- Their ecommerce platform (Shopify, WooCommerce)
- Their CRM if applicable (HubSpot, Pipedrive)
Step 4: Verify Data Accuracy
Before you show any dashboard to a client, spot-check the numbers.
Pull last month’s Meta Ads spend from the Meta Ads Manager directly. Compare it to what your dashboard shows. If they match, you’re good. If they don’t, investigate before the client notices.
Data discrepancies are the fastest way to lose a client’s trust in your reporting system.
Step 5: Set Up Automated Report Delivery
Once the dashboard is verified, configure delivery:
- Weekly email digest: Key metrics for the past 7 days, delivered Monday morning
- Monthly summary: Rolled up metrics, month over month
- Anomaly alerts: Trigger when ROAS drops more than 20%, or spend exceeds the weekly cap
Set this up for each client using their preferred format (email, Slack, dashboard link).
Step 6: Share the Live Dashboard Link
Give the client a link to their live dashboard. This is a read-only view that shows their data in real time. They can check anytime without asking you for a screenshot.
This single change, giving clients direct dashboard access, dramatically reduces “can you send me a quick update?” messages.
What to Do When a Client Has Unusual Needs
Most clients fit the standard reporting package. Occasionally you have a client with unusual needs:
Multiple brands or properties under one client. Some clients have 3 Shopify stores, 2 Meta Ads accounts, and 4 Google Ads accounts. The right setup is one client workspace with multiple data connections organized by property.
Offline or non-integrated data sources. Some clients have CRM data in a custom system with no API. For these, a Google Sheets import (manual refresh) is often the pragmatic solution while maintaining the automated dashboard for everything else.
Executive summary format. Some clients want a one-page summary, not a full dashboard. This is where automated email digests (text-based, key numbers only) outperform visual dashboards.
The Cost of Getting This Wrong
A poorly set up multi-client dashboard system is expensive in non-obvious ways.
When a client’s Zap breaks and no one notices for three days, you’re delivering them wrong data. When a formula in a spreadsheet breaks and a number looks fine but is actually off, you’re building a report on bad data. When a client’s dashboard is showing last month’s numbers because someone forgot to run the data pull, you’re eroding trust.
The more clients you have, the more catastrophic a fragile reporting system becomes. At 20 clients, one broken connection affects 5% of your portfolio. The right system catches that in minutes, not days.
The Best Multi-Client Dashboard Setup for Marketing Agencies in 2026
If you’re starting from scratch or rebuilding:
5 clients or fewer: Looker Studio + Supermetrics. High customization, low monthly cost. Requires technical setup.
5 to 20 clients: A purpose-built platform is worth the cost. The time saved on new client setup (10 minutes vs. 2 hours) pays for itself within the first few months.
20+ clients: Flat-rate pricing is non-negotiable. AgencyAnalytics at 20+ clients costs $400+/month. Braidscope Agency Pro covers unlimited clients at $199/month.
The goal is a system where adding a new client is a 10-minute task, not a half-day project. When you get there, your agency can scale without your reporting burden scaling proportionally.
See how Braidscope handles multi-client dashboards. We’re in closed beta, accepting agencies at founder pricing.