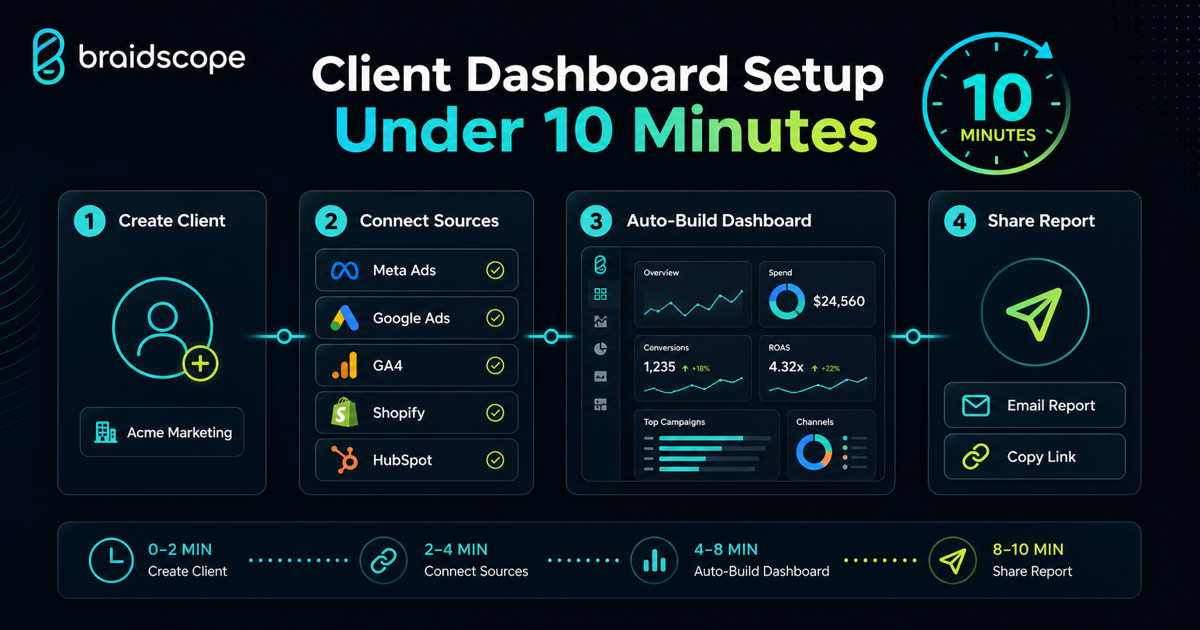
Every new client should not require a new reporting build.
That is the old way: duplicate a dashboard, reconnect sources, fix filters, check metrics, customize widgets, and hope nothing breaks before the first report.
The better way is to define the reporting package once, then create a client workspace that builds itself from connected data.
Quick takeaways
- A client dashboard is useful only if the client can understand the first screen without a walkthrough.
- Setup should follow the same repeatable workflow for every client: workspace, sources, QA, share.
- The real win is not a prettier dashboard. It is fewer setup hours and fewer client questions.
Who this matters for
If you own an agency, dashboard setup is not just a technical task. It is margin leakage. Every hour your team spends reconnecting sources, checking filters, and cleaning up dashboard views is an hour not spent on strategy or client growth.
If you are a founder doing your own marketing, the pain is different. You may not have 12 clients, but you do have 12 tabs. Meta Ads, Google Ads, GA4, Shopify, HubSpot, Stripe, Sheets, and whatever else your business runs on. The same dashboard principle applies: one place to see what is working.
If you are a business owner or operator, you probably do not care what reporting tool is used. You care whether the numbers are current, whether they are easy to trust, and whether your team can explain them without sending you into five different platforms.
The old setup problem
For many agencies, dashboard setup takes 2 to 3 hours per client.
That includes:
- collecting access
- connecting data sources
- copying templates
- changing filters
- checking date ranges
- reviewing numbers
- sharing links
- explaining the dashboard
At 10 new clients, that is 20 to 30 hours of setup work.
The new way
The new way is simple:
- Create the client workspace
- Connect the data sources
- Let the dashboard structure appear
- Verify key numbers
- Share the client view
This is the workflow Braidscope is built for. Connect Meta Ads, Google Ads, GA4, Shopify, HubSpot, or Google Sheets, and the dashboard is created around the data source.
What a client dashboard needs
Do not include everything.
A client dashboard needs:
- primary business KPI
- channel performance
- trend over time
- spend or cost where relevant
- conversion or revenue result
- top campaigns, products, or pages
- plain-English summary
- next action
For more detail, read our multi-client dashboard guide.
Step 1: Define the reporting package
Before building anything, define what the client bought.
For example:
- weekly paid media pulse
- monthly ecommerce performance review
- SEO monthly growth report
- live client dashboard plus Slack digest
The dashboard should match the service package.
Step 2: Create the client workspace
Each client should have an isolated workspace.
This avoids permission problems and makes it easier for your team to switch between clients.
It also reduces the risk of one client seeing another client’s data.
Step 3: Connect data sources
Connect only the sources needed for the reporting promise.
For paid media, that may be Meta Ads, Google Ads, and GA4.
For ecommerce, add Shopify.
For B2B, add HubSpot.
For custom tracking, add Google Sheets.
Step 4: Verify data accuracy
Before sharing the dashboard, check:
- date ranges
- currency
- attribution settings
- conversion definitions
- source connections
- client account access
A fast dashboard is not useful if the first client call becomes a data argument.
What a normal client actually sees
Most clients do not open a dashboard thinking, “I want to inspect my attribution model.”
They open it thinking:
- Are we up or down?
- Is the spend under control?
- What changed?
- Do I need to make a decision?
That is why the first screen should be simple. Revenue, leads, spend, ROAS, conversion rate, or pipeline should be visible without hunting. The deeper campaign and source details can sit below.
If the first dashboard view feels like a cockpit, the client will stop using it.
Step 5: Share the live dashboard link
Keep the client view simple.
Do not give them raw platform access unless they need it. Share a read-only dashboard that answers the questions they actually ask.
Then use automated reports for the recurring summary.
Common setup mistakes
The first mistake is showing too many metrics.
The second is sharing raw GA4 or ad account access and expecting the client to self-serve.
The third is skipping the context layer. A dashboard without interpretation still creates questions.
Another mistake is making the dashboard too agency-centric. A paid media buyer may care about campaign structure, but the client usually cares about budget, return, and next action.
Bottom line
Client dashboard setup should be a repeatable process, not a custom build every time.
If you want dashboards that appear when you connect data sources, join the Braidscope closed beta and lock in founder pricing before launch.