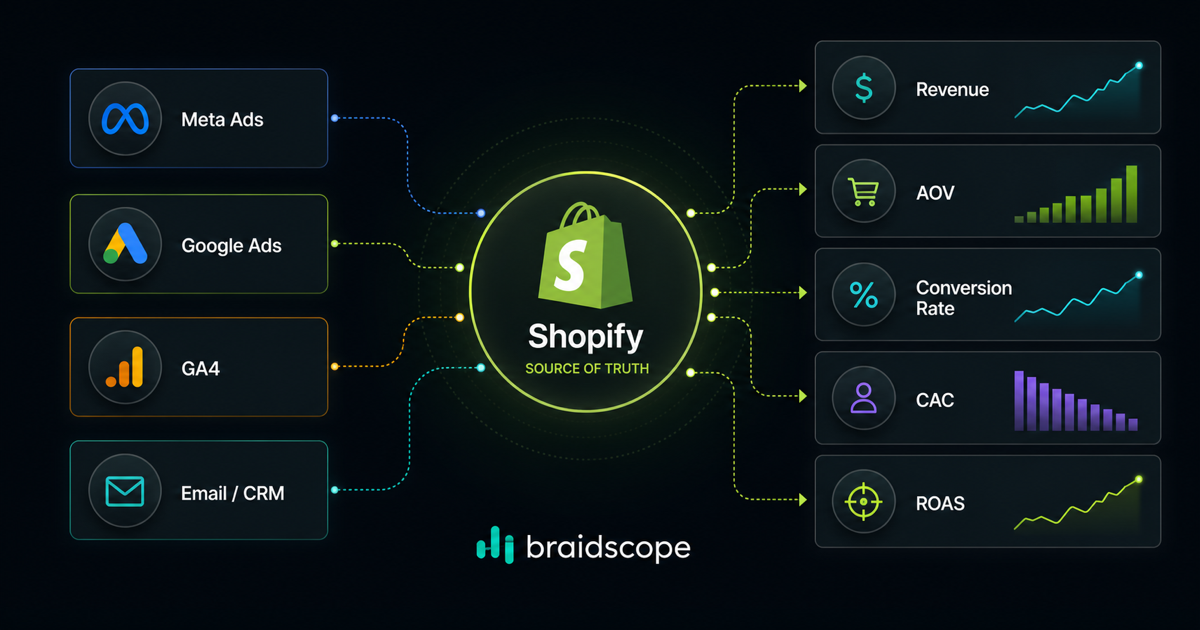
Ecommerce agency reporting is unforgiving because the client can see revenue every day.
If your report does not connect marketing activity to store performance, it will feel incomplete. The client wants to know what happened to revenue, what drove it, and what you are doing next.
That means Shopify, Meta Ads, Google Ads, and GA4 need to be reported together.
Quick takeaways
- Ecommerce reporting needs to connect store revenue with ad spend and website behavior.
- Shopify is usually the revenue source of truth, while ad platforms explain channel performance.
- MER and ROAS answer different questions, so clients should understand both.
The four-reader test
An agency owner reads an ecommerce report and asks, “Can my account manager explain this without pulling three exports?”
A founder running his own store asks, “Do I know what to fix this week?”
A business leader asks, “Is marketing spend creating profitable growth?”
A normal client asks, “Are sales up, and should I be worried?”
If the report cannot answer those questions quickly, it is too complicated.
Why ecommerce reporting is harder
Ecommerce has messy attribution.
Meta Ads may claim revenue. Google Ads may claim revenue. Shopify shows actual orders. GA4 may show a different total. Refunds and discounts can change the picture again.
The agency’s job is to explain the system, not pretend every number will match perfectly.
The three channels to cover
Most ecommerce reports need:
- Meta Ads for paid social acquisition and retargeting
- Google Ads for search, shopping, and demand capture
- GA4 for website behavior and channel comparison
- Shopify for actual store revenue
Shopify is usually the revenue source of truth.
Five metrics every ecommerce client asks about
Include:
- revenue
- ROAS
- AOV
- conversion rate
- MER
MER is especially useful because it compares total revenue to total marketing spend. It helps clients understand overall efficiency beyond platform attribution.
MER vs ROAS
ROAS is useful for platform-level performance.
MER is useful for business-level performance.
Use ROAS when deciding whether a campaign or platform is working. Use MER when deciding whether total marketing spend is efficient for the store.
Clients should understand both.
Build a combined Meta plus Shopify view
A useful ecommerce dashboard shows:
- Meta spend
- Google spend
- Shopify revenue
- total orders
- AOV
- conversion rate
- ROAS by platform
- MER
- top products
This gives the client a single view of growth instead of disconnected reports.
Braidscope is built to create this kind of client workspace automatically when sources are connected.
For more on Shopify specifics, read Shopify reporting for agencies.
Attribution windows
Explain attribution windows simply.
Example:
“Meta may credit purchases within a selected click or view window. Shopify records actual store orders. Because of that, platform revenue and store revenue will not always match.”
This prevents confusion before it becomes mistrust.
What the first screen should show
The first dashboard screen should not start with channel detail.
Start with:
- total revenue
- total ad spend
- MER
- orders
- AOV
- conversion rate
- week-over-week or month-over-month change
Then break down Meta, Google, organic, and email below.
This keeps the conversation focused on business performance before channel debates.
Automating ecommerce reporting
Manual ecommerce reporting is slow because the data comes from several places.
You need Shopify, ads, analytics, and sometimes sheets or CRM data.
Braidscope connects the main sources into one client workspace so your agency can spend less time pulling numbers and more time explaining growth.
See the ecommerce agency use case for the broader workflow.
Bottom line
Ecommerce reporting should tie marketing spend to store revenue.
If your agency wants Shopify, Meta Ads, Google Ads, and GA4 in one client dashboard, join the Braidscope closed beta and lock in founder pricing before launch.