HubSpot has a lot of useful data. That is exactly why HubSpot reporting can get messy.
Clients do not need every CRM field in a report. They need to understand whether marketing is creating pipeline, which sources are producing quality leads, and where deals are getting stuck.
The best HubSpot reports simplify the funnel.
Quick takeaways
- HubSpot reports should show pipeline quality, not just form fills.
- CRM data is useful only if lifecycle stages, deal stages, and sources are clean enough to trust.
- The best client view simplifies the funnel from lead to qualified opportunity to revenue.
Why this matters beyond agencies
For an agency owner, HubSpot reporting proves whether campaigns are creating pipeline, not just leads.
For a founder, it shows whether marketing activity is turning into real sales conversations.
For a business leader, it answers where revenue is likely to come from next.
For a normal client, the report needs to avoid CRM clutter and say what changed in the funnel.
Why HubSpot reporting is tricky
CRM data is rich, but it depends on process discipline.
If sales reps do not update deal stages, the pipeline report is wrong. If lifecycle stages are inconsistent, lead reporting gets muddy. If attribution is not configured, source performance is incomplete.
Before reporting HubSpot data to a client, check whether the data can be trusted.
What B2B clients want to see
Most B2B clients care about:
- leads by source
- qualified leads
- cost per lead
- cost per qualified lead
- pipeline value
- deals created
- deals closed
- conversion rate by lifecycle stage
- sales cycle length
The agency report should connect marketing work to pipeline, not only form submissions.
Core HubSpot metrics
Include:
- new contacts
- MQLs or SQLs
- contacts by source
- landing page conversion rate
- deal value created
- deals closed won
- funnel conversion rate
- revenue by source where available
Avoid overwhelming the client with every property, list, and workflow.
Connect HubSpot to ad data
HubSpot becomes more useful when it is tied to spend.
For example:
- Google Ads spend to qualified leads
- Meta Ads spend to booked calls
- campaign source to pipeline value
- landing page to closed won revenue
This is how you move from “we generated 80 leads” to “we generated 19 qualified opportunities at $142 each.”
HubSpot reports vs API vs Braidscope
HubSpot’s native reports are good for teams living inside HubSpot. They are less ideal when the agency needs to combine CRM data with ad platforms, analytics, and spreadsheets.
API workflows can solve this, but they require technical setup.
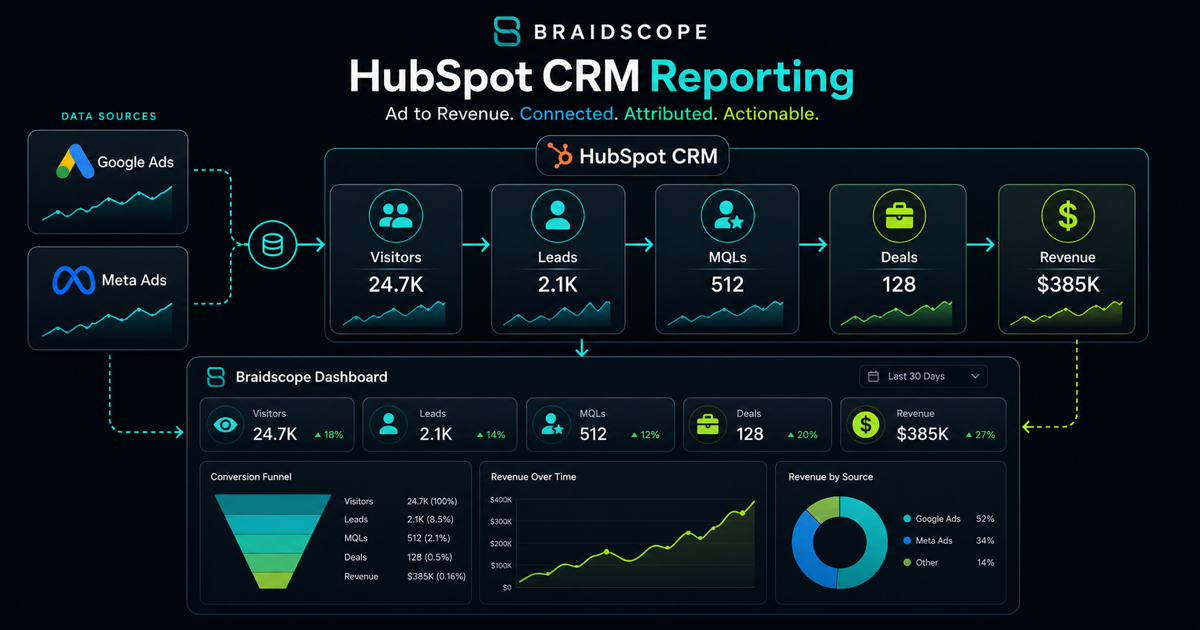
Braidscope is designed to pull HubSpot into a client workspace with other sources like Meta Ads, Google Ads, GA4, Shopify, and Google Sheets. That gives the agency a clearer cross-channel view.
If you are building this across many clients, read our multi-client dashboard guide.
Present funnel data simply
Use a funnel view:
- Visitors
- Leads
- Qualified leads
- Opportunities
- Closed won
Then show conversion rates between stages.
Clients who are not in HubSpot every day need the story, not the database.
The quality layer
Do not stop at lead count.
Add a quality view:
- leads accepted by sales
- leads rejected by sales
- meetings booked
- opportunities created
- pipeline value
- closed won revenue
This is where HubSpot reporting becomes useful. It shows whether marketing is producing opportunities the business can actually close.
Bottom line
HubSpot reporting should show whether marketing is creating qualified pipeline.
Keep the report focused on source quality, funnel movement, and revenue impact.
If you want HubSpot reporting alongside ads, analytics, and automated client reports, join the Braidscope closed beta and lock in founder pricing before launch.