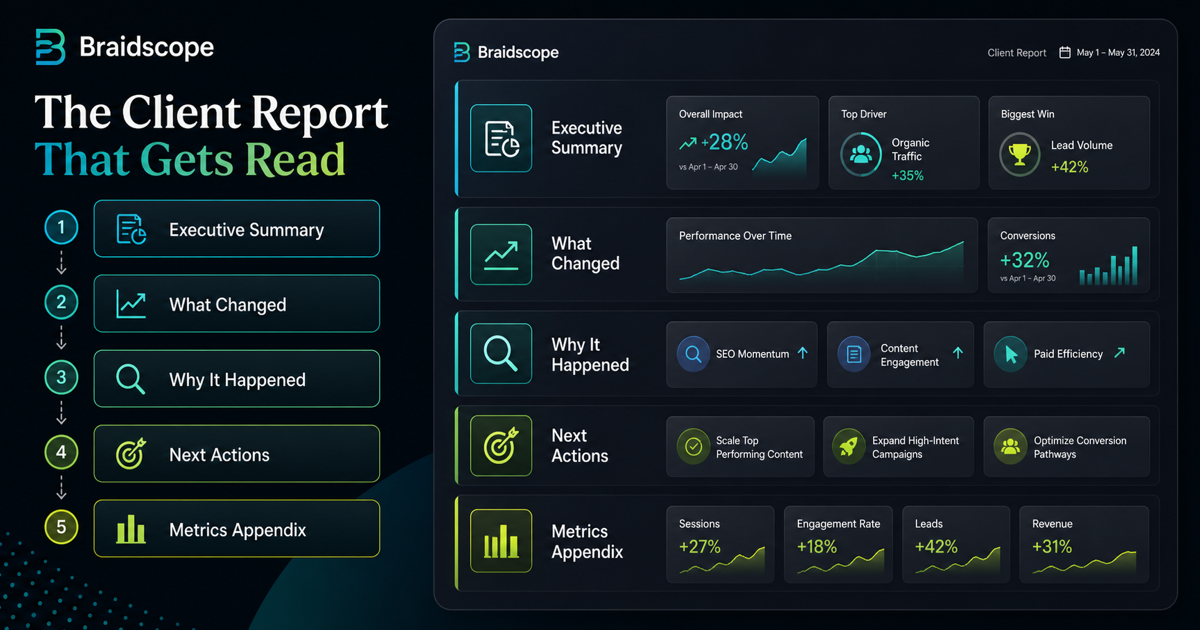
Most client reports are built for the agency, not the client.
They include every number the team worked on, every campaign, every chart, and every channel. Then the client skims the first page, asks one question in Slack, and ignores the rest.
A good client report does not show everything. It shows what matters, explains what changed, and makes the next decision easier.
Quick takeaways
- A report gets read when it starts with the answer, not the data.
- Use 3 to 5 metrics tied to the client’s actual goal, then explain what changed.
- Every report should include one clear recommendation so the client knows what happens next.
Who you are writing for
You are not writing for another marketer.
You are writing for a person who has payroll, revenue targets, client pressure, inventory, sales calls, or leadership questions waiting after they close the report.
That person may be an agency client, a founder managing his own platforms, or a department leader who only wants one clean dashboard. Keep that reader in mind and the report gets better immediately.
Step 1: Lead with the summary
Do not start with a table.
Start with a short plain-English summary:
- what happened this period
- whether performance improved or declined
- why it happened
- what the agency recommends next
Example:
“Revenue increased 12% this week. The main driver was stronger retargeting performance on Meta Ads. Prospecting spend is still learning, so next week we are shifting 15% of budget into the highest-performing creative set.”
That summary tells the client what to think about the numbers before they see the charts.
Step 2: Pick 3 to 5 metrics
A client report should not include 30 metrics unless the client specifically asked for that level of detail.
Pick the metrics tied to the client’s goal.
For ecommerce:
- revenue
- ROAS
- conversion rate
- AOV
- MER
For lead generation:
- leads
- qualified leads
- cost per lead
- conversion rate
- pipeline value
For SEO:
- organic sessions
- organic conversions
- search impressions
- ranking movement
- assisted revenue or leads
If a metric does not help the client make a decision, move it to an appendix or leave it out.
Step 3: Add context
Raw numbers do not build trust. Context does.
Compare each core metric against:
- last week or last month
- target
- baseline
- budget
- seasonality
“ROAS is 2.8x” is less useful than “ROAS improved from 2.1x to 2.8x after we paused two low-performing ad sets.”
Step 4: Interpret the result
Clients hire agencies because they want judgment, not only data collection.
Every important number should have a short interpretation.
Bad:
“CTR increased to 1.8%.”
Better:
“CTR increased to 1.8%, which suggests the new creative angle is getting stronger attention. We are testing whether that attention converts into purchases before increasing spend.”
This is where AI-assisted reporting can help. Braidscope lets teams ask plain-English questions about client data, then use those answers as a starting point for the report.
Step 5: Include one recommendation
A client report should lead to action.
Do not include five vague recommendations. Include one clear next move.
Examples:
- increase budget on the highest ROAS campaign
- refresh creative because frequency is rising
- fix landing page speed before scaling traffic
- pause low-quality lead sources
- add a Shopify bundle to lift AOV
The recommendation proves the agency is managing the account, not just reporting on it.
Step 6: Choose the right delivery format
Different clients prefer different formats.
Email is fine for monthly summaries. Slack works well for weekly pulses. Dashboard links work for clients who want live access. PDFs still work for board-style reporting.
The best setup is usually a live dashboard plus a short weekly or monthly written summary.
If you want the dashboard layer, read our multi-client dashboard guide. If you want the delivery layer, read how to automate client reporting.
Step 7: Automate the data pull
Your team should write analysis, not copy numbers.
Manual reporting creates three problems:
- it takes too long
- it introduces errors
- it makes reporting easy to delay
Automate data collection from Meta Ads, Google Ads, GA4, Shopify, HubSpot, and Google Sheets wherever possible.
Braidscope is built for this workflow. Each client gets a workspace, data sources sync automatically, dashboards appear, and reports can go out through Slack or email.
Example report structure
For a Meta Ads plus Shopify client, use:
- Executive summary
- Revenue, spend, ROAS, MER
- What changed this week
- Campaign performance
- Top products or offers
- Creative notes
- Recommendation
- Next actions
That is enough for most clients. The detail can live in the dashboard.
The tone clients trust
Clients trust calm, specific language.
Avoid robotic phrases like “performance indicates positive directional momentum.”
Write the way you would explain it on a client call:
“Revenue is up. The main reason is better retargeting. New customer acquisition is still below target, so we are not scaling prospecting yet.”
That sounds like a person who is managing the account.
Bottom line
A report that gets read is short, clear, and useful. It explains the business result before it shows the data.
If you want client reports that update automatically and give your team AI-assisted answers, join the Braidscope closed beta and lock in founder pricing before launch.